Drew Ludwig · 23 October 2026
Mapping the Spread of Conceptual Clusters Across User-Curated Note Networks
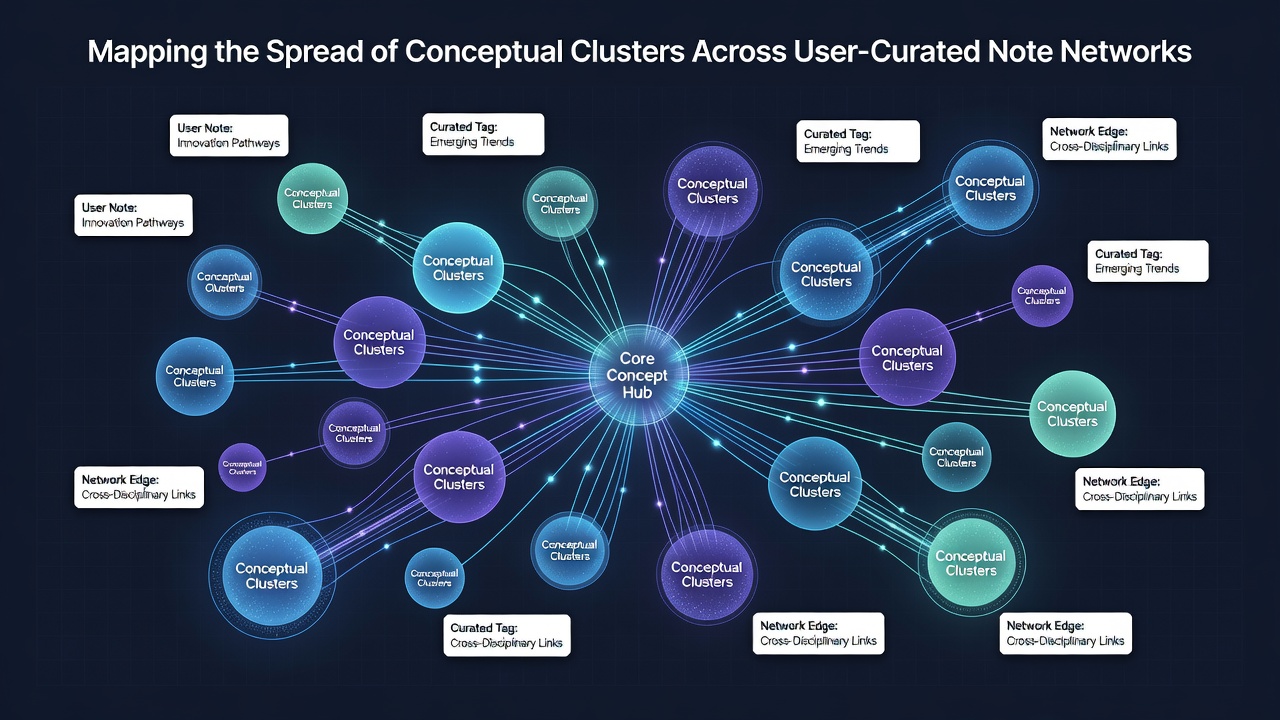
Digital note-taking platforms allow individuals to build personal knowledge bases where notes connect through bidirectional links, tags, and references, which creates structures that researchers analyze as graphs. Conceptual clusters emerge when related ideas group together through repeated connections, and mapping their spread involves tracking how these groups form, expand, and interact over time. Studies in network science apply clustering algorithms such as Louvain method or modularity optimization to identify these dense regions within larger note graphs.
Formation of Conceptual Clusters in Note Networks
Users curate notes by adding content on specific topics while establishing links that reflect associations, and this process generates clusters when multiple notes share overlapping themes or keywords. Data from platforms like Obsidian and Roam Research shows that clusters often center on core ideas such as project management or scientific concepts, with peripheral notes connecting through weaker ties. Researchers discovered that cluster density increases when users revisit and expand notes regularly, which strengthens internal connections while new ideas enter through external sources or cross-references.
Graph metrics including betweenness centrality and eigenvector scores help quantify how central a note becomes within its cluster, and these measurements reveal patterns where certain concepts act as hubs that draw in related information. One study revealed that clusters evolve through stages of initial formation, consolidation, and occasional fragmentation when users reorganize links. Observers note that temporal analysis of edit histories provides insights into the pace at which clusters grow, particularly in environments where daily additions accumulate over months.
Techniques for Mapping Cluster Spread
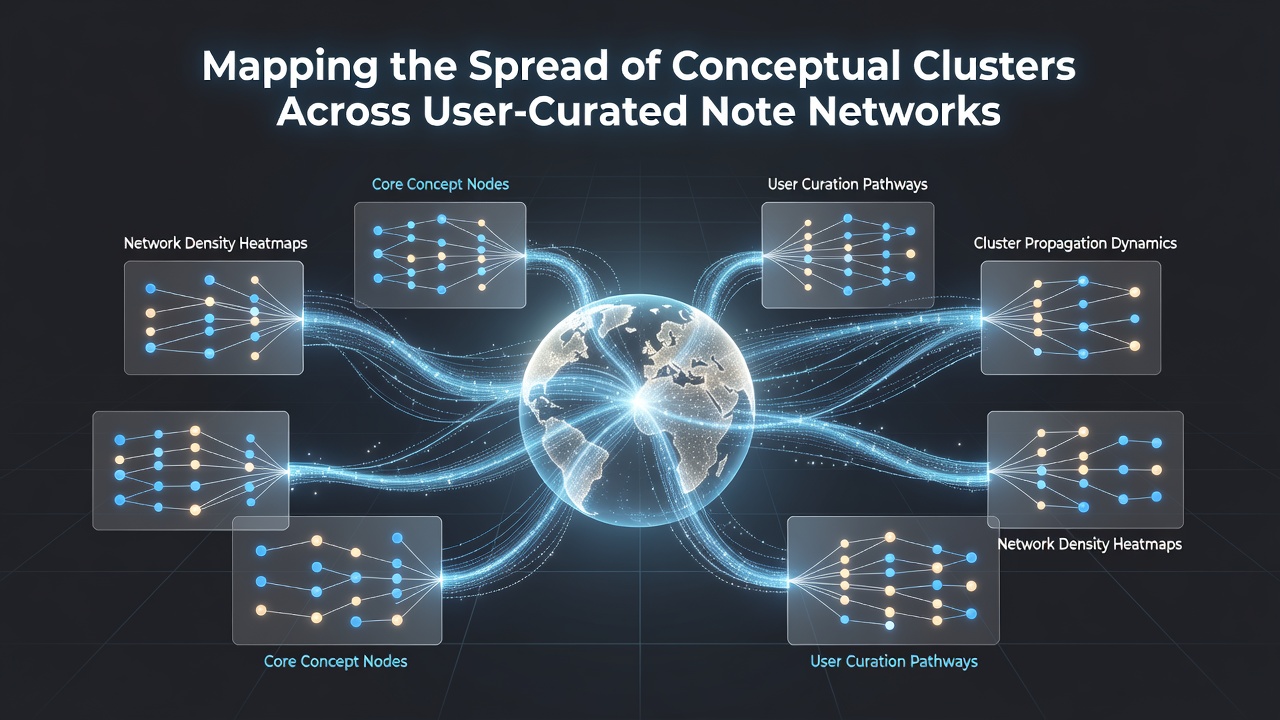
Mapping relies on exporting note data into formats compatible with network analysis tools such as Gephi or Python libraries like NetworkX, after which algorithms detect communities and visualize their positions relative to one another. Edge weights based on link frequency or semantic similarity refine the accuracy of cluster boundaries, and this approach allows analysts to track how one cluster influences adjacent groups through bridging notes. Evidence suggests that dynamic visualizations updated in real time capture the movement of concepts as users introduce new connections or merge existing clusters.
Text embedding models convert note content into vector representations, which then feed into dimensionality reduction techniques like UMAP to project clusters in lower-dimensional space for easier interpretation. Those who've studied these systems find that combining structural graph data with semantic vectors yields more robust maps than either method alone. In October 2026, updated open-source toolkits incorporated improved handling of large-scale personal note collections, which enabled finer resolution in detecting subtle cluster boundaries across thousands of interconnected entries.
Observed Patterns in Real-World Networks
Analyses of public and anonymized note datasets indicate that conceptual clusters tend to follow power-law distributions in size, with a few large thematic areas dominating while many smaller clusters persist around niche interests. Cross-cluster interactions occur through notes that reference multiple domains, and these bridges facilitate the gradual spread of ideas from one group to another. According to research published by the University of Toronto's Knowledge Media Design Institute, link velocity within clusters accelerates during periods of focused user activity such as research sprints or project deadlines.
Patterns also emerge around temporal clustering where notes created within similar time windows share higher connectivity, which reflects the influence of current events or learning sequences on cluster development. Data indicates that users who maintain consistent linking practices see more stable clusters over extended periods, whereas sporadic activity leads to looser structures prone to reorganization. Experts have observed that interdisciplinary topics generate clusters with higher betweenness scores because they naturally attract connections from disparate areas.
Applications and Analytical Frameworks
Professionals in fields ranging from academic research to personal productivity apply cluster maps to identify knowledge gaps or redundant notes within their systems. Frameworks borrowed from bibliometrics adapt citation analysis methods to note networks, treating links as citations and clusters as research fronts. A report from the Australian Research Council highlights how such mappings support longitudinal studies of individual learning trajectories by documenting when and how new conceptual areas integrate into existing structures.
Software extensions now automate parts of the mapping process through plugins that generate interactive cluster views directly inside note applications. These tools calculate metrics on the fly and suggest potential new links based on cluster proximity. What's interesting is that comparative studies across user cohorts reveal consistent scaling laws where cluster count grows logarithmically with total note volume, while average cluster size plateaus after an initial expansion phase.
Conclusion
Mapping the spread of conceptual clusters across user-curated note networks combines graph theory, semantic analysis, and temporal tracking to produce detailed representations of how ideas organize and evolve in personal knowledge systems. Continued advances in analytical methods and data availability support increasingly precise examinations of these structures, which in turn inform both individual practices and broader understanding of knowledge formation in digital environments. Researchers continue to refine techniques that capture the dynamic nature of cluster interactions while maintaining fidelity to the underlying user-generated connections.